Dashboard for Gold
Gold is a precious metal that has been used for centuries in jewelry, currency, and as an investment.
Understanding the Gold backtest
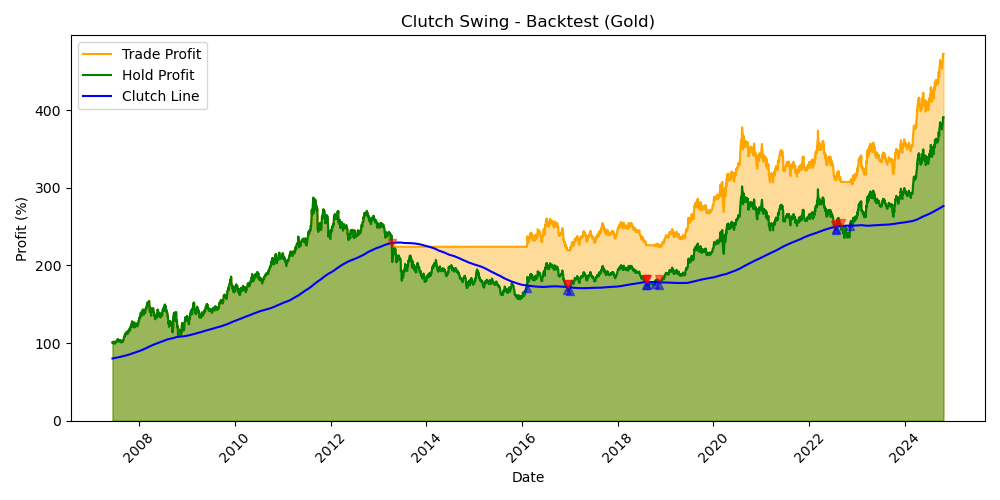
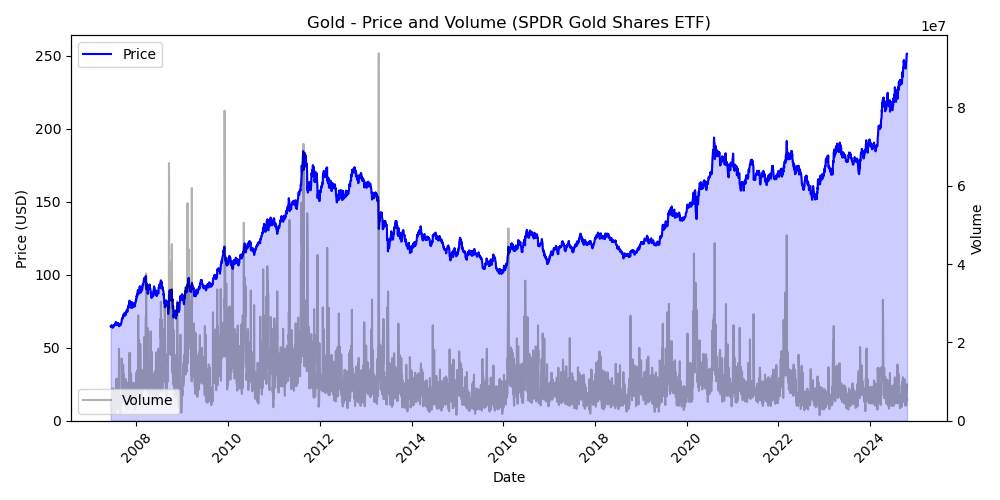
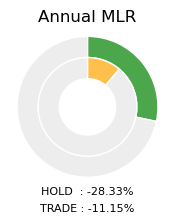
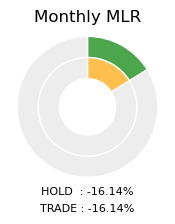
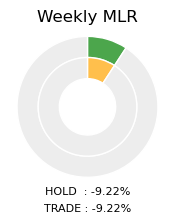
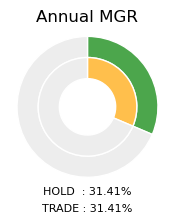
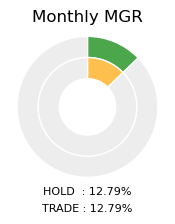
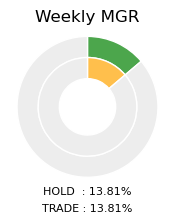
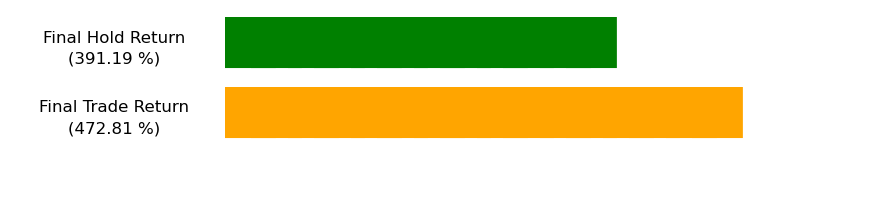
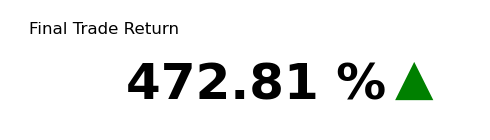
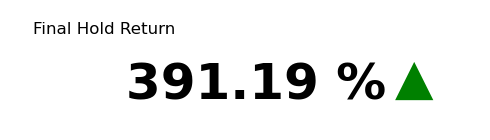
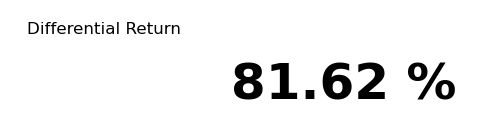
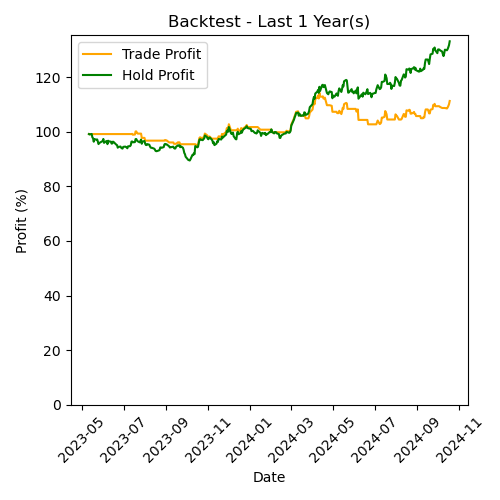
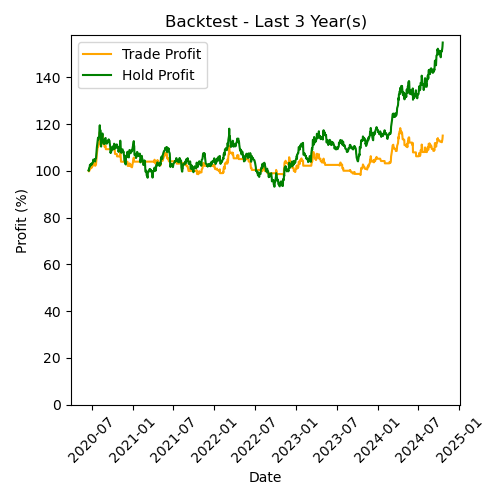
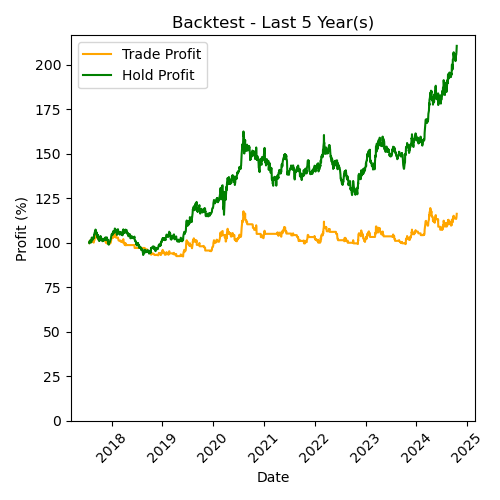
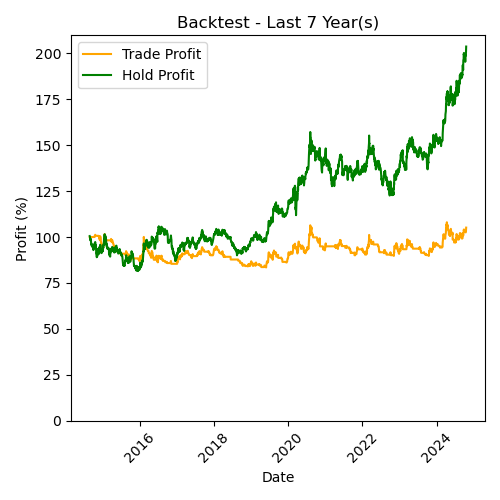
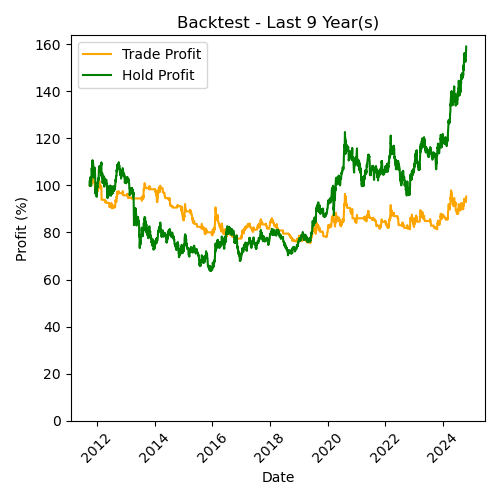
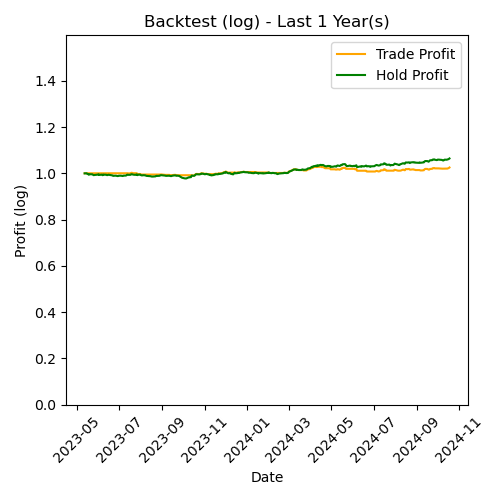
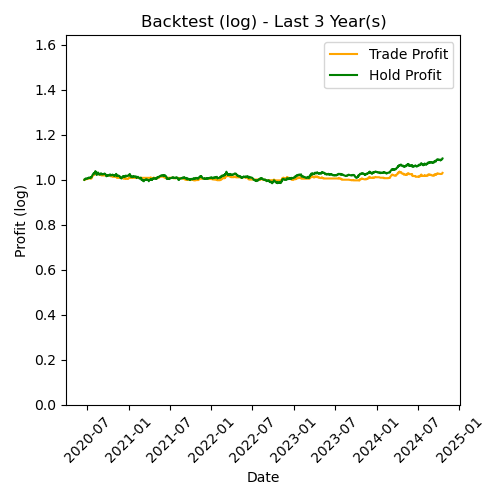
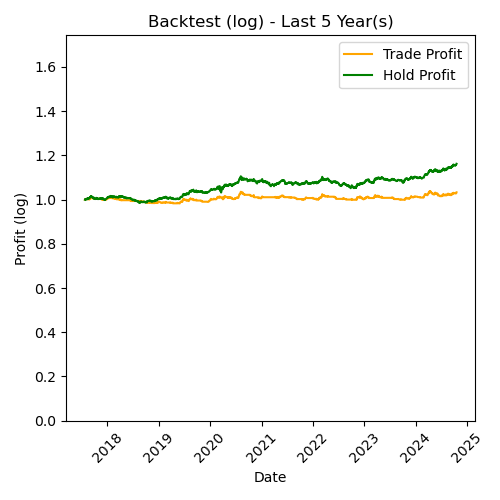
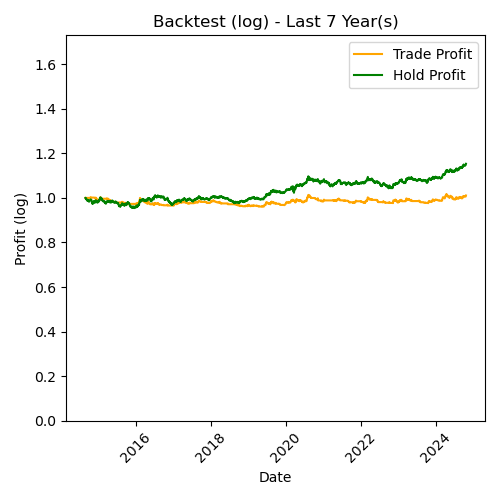
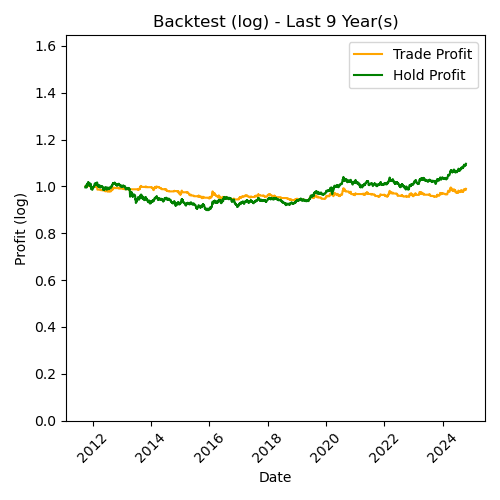
These Gold charts use SPDR Gold Shares (GLD) price data and compare the historical performance of the Clutch Swing strategy with buying and holding GLD over the same analysis period. Each period starts with the same initial asset value.
The period return charts show cumulative returns in percent. The logarithmic charts show an asset index starting at 100: an index of 150 represents a 50% gain, while 80 represents a 20% loss. Blank areas indicate unavailable history.
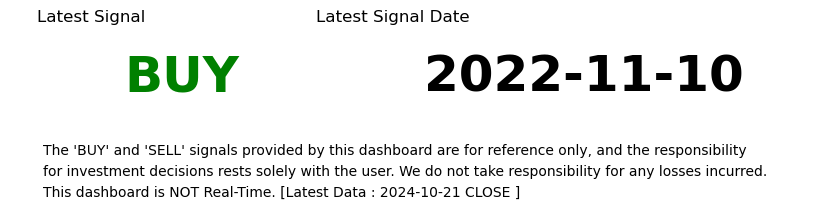
The backtest assumes trades at the signal day's closing price and excludes transaction fees and slippage. Historical results do not guarantee future returns.
Gold returns by period
Price data through . Returns are cumulative, not annualized. The dates below show the actual calculation period.
Loading return data...
| Period | Actual date range | Strategy return | Buy-and-hold return | Difference (pp) |
|---|
Difference = strategy return minus buy-and-hold return, in percentage points (pp). Values are rounded independently to two decimal places.
Copyright © 2024 Clutch Swing. All rights reserved.
Reproduction without permission is prohibited.